Covid-19 Deaths in England & Wales
A joint article by Steve Whitehouse and John Sullivan, originally published on LinkedIn, April 2021.
Summary
Following our recent paper examining the UK’s preparation for managing a pandemic, this article looks at the outcome of the Covid-19 (‘Covid’) pandemic in terms of the death toll.
Our objective is to cut through some of the confusion caused by the emotive and misleading treatment of the pandemic by the government, the public health establishment and mainstream media, exacerbated by the inconsistent presentation of several conflicting data sets. We provide an assessment of the real cost of the pandemic in lives lost, and place this in an appropriate context compared to other pandemics and mortality risks.
We find that the impact of the pandemic in the UK has been significantly over-stated, especially for the “2nd wave” of the past winter, as compared to the first wave last spring. The worst of the true pandemic was behind us in the UK last summer, and the dramatic spike in “Covid deaths” after Christmas was largely due to the misattribution of deaths from other causes.
The maximum number of true Covid deaths in England & Wales cannot be more than the number of excess deaths compared to the historical average which, according to the Office for National Statistics (ONS) is approximately 111,000. In reality, deaths from other causes due to the lockdown – withdrawal of business-as-usual NHS services, additional deaths from dementia, alcohol abuse and so on – are likely to have inflated that number. Due to data limitations, it is unlikely that we will ever know the true situation, but we can say with reasonable confidence that the real deaths ‘from Covid’ did not exceed 100,000 – helped by the apparent, and as yet not fully understood, disappearance of influenza world-wide.
We conclude that the lockdown measures were excessive, unnecessary and ineffective. It is important to stress, above all else, that the disproportionate socio-economic damage to the UK is ongoing. All restrictions should end now, the government’s “roadmap” should be dramatically accelerated, and lockdowns should never again be considered as a response to a relatively unexceptional public health threat – we need protection passed in law and/or a written constitution to prevent such government over-reach in future.
An immediate public enquiry is needed, drawing on independent expertise, to urgently investigate the truth of this pandemic and the UK response, and to ensure that the British people are not subjected once again to an unwarranted and unconstitutional removal of fundamental civil liberties next autumn.
Introduction
There is no question that Covid has had a severe impact globally, and we do not wish to trivialise the cost in human lives, estimated by the World Health Organisation (WHO) to be approaching 3 million deaths as of 11th April 2021. As we show, however, such statistical estimates are imprecise and can be misleading if used to further a particular agenda. Before we examine the Covid numbers in detail, deaths from some other selected health threats provide important context:
The outbreak of Spanish ’flu at the end of the first world war is thought to have cost between 20 and 50 million lives.
The death toll from Hong Kong ’flu in 1968-9 is estimated at between 1 and 4 million.
Cancer costs nearly 9 million deaths globally, every single year.
The global annual death toll from malaria is still around 400,000.
HIV-AIDS has killed around 32 million since its emergence, including nearly 700,000 in 2019.
The Black Death killed between 75 and 200 million people, when the population of the world was less than one tenth of what it is today.
Approximately 530,000 people die in England and Wales every year (600,000 in the UK as a whole).
In a typical year there are 20,000 to 30,000 deaths from influenza and pneumonia. In 2018, a “bad ‘flu season”, there were approximately 20,000 additional (excess) deaths, although the excess is not fully understood and these deaths are not attributable directly to influenza and pneumonia in the ONS ‘nomis’ reporting system.
Covid, therefore, while unquestionably a very nasty disease which has had a high toll in human misery, is not particularly exceptional in the wider context and disproportionately affects people over 70 years old.
What was unique about this pandemic was the perceived risk of modern first-world health services being overwhelmed in the short term, causing severe embarrassment to national governments and an opportunity for the more hysterical elements of the mainstream media to spread alarmist panic.
But, while staff shortages due to self-isolation were undoubtedly a significant issue, the UK NHS as a whole was never overwhelmed; the Nightingale hospitals were decommissioned without ever being used, and the occupancy of critical care beds in the UK never exceeded the available surge capacity. Nor was this unique to the UK, the US navy hospital ship dispatched to New York at the height of the initial outbreak went similarly unused – this in spite of the excess deaths in New York peaking at 4 times the normal total (500% of the base rate), as described by the Nobel laureate Professor Michael Levitt in this excellent video interview with Ivor Cummins.
In September 2020, the Institute for Government reported that the pandemic had caused the deepest recession in 300 years and estimated the overall cost at over £300 billion – equivalent to nearly £5,000 for every man, woman and child in the UK. Since then, the furlough scheme has been further extended and other costs will continue to rise as long as ‘mitigation’ measures are maintained. The final costs could approach £10,000 for every UK citizen, this profligate use of our money by the Government must stop.
The costs of the pandemic and our response are not of course limited to the immediate death toll or financial impact. The ‘collateral’ risks include additional deaths from non-Covid causes, disrupted education for millions of schoolchildren and university students, the mental health implications of lockdown and the incessant fearmongering narrative, and so on.
In short, the death toll from the pandemic has been far from unique, nor even particularly exceptional. Our response though has been utterly unprecedented, and we will show that – in the UK at least – it has been based on a misrepresentation of the true mortality impact.
Background to the Data
It is generally agreed that the only true measure of the overall impact of a pandemic is ‘excess mortality’ – the number of deaths above what would normally be expected in a typical period. Everything else can ultimately be consigned to the dustbin of “lies, damned lies, and statistics”. Yet, to a real and significant degree, the socio-economic fabric of the UK has been laid low by a disingenuous narrative espoused relentlessly by a relatively small number of bad actors in government, public health, and the mainstream media.
There are several sets of official statistics relating to UK deaths during the pandemic, including:
Deaths within 28 days of a positive SARS-Cov-2 test result.
Prior to last August, Public Health England (PHE) recorded deaths within any (unlimited) period of a positive PCR test. Following criticism of that approach, PHE changed their methodology in August 2020. They now maintain separate data sets for deaths within 28 days and 60 days of positive tests, but it is the 28-day data which is published daily.
The daily figures are published for each of the home nations individually as well as for the UK overall, and in two formats; by date reported and by date of death. The cumulative totals are the same but, while the ‘date reported’ numbers are fixed once published, the ‘date of death’ numbers can be updated subsequently due to reporting delays. For comparing numbers with other data sets over a specific historical period, it is appropriate to use the ‘date of death’ data set.
Until recently, the vast majority of tests were of the polymerase chain reaction (PCR) type. In the past several weeks, however, the number of PCR tests has been overtaken by the number of lateral flow tests (LFT’s), also commonly known as rapid antigen tests. LFT’s are more appropriate to indicate someone who is currently infectious but, for analysing statistics over extended time periods, we consider it valid to treat results from both PCR tests and LFT’s on an equal basis.
Deaths with COVID mentioned on the death certificate.
These statistics are also published by individual nation and for the UK as a whole, and include any death “where COVID is mentioned as a cause on the death certificate”. These can be primary or secondary (contributory) causes and are based on the professional opinion of the doctor issuing the death certificate, often on the basis of incomplete information and frequently in the absence of an actual Covid test.
Excess deaths compared to the average of the previous 5 years.
As with much of the language popularised in the past year, the term ‘excess deaths’ can cause confusion. The UK experiences ‘excess winter deaths’ every year, meaning simply that more people die in the winter than in summer.
Excess deaths in the context of Covid19 means the additional deaths which happen in a particular period compared to the same period in previous years, for example in January. These numbers are published weekly, in the case of England and Wales, by the ONS. The Scottish government publishes their own figures separately, as do Northern Ireland.
Because of the multiple different data sets, methodology variations and so on, it is a continuous challenge to compare mortality statistics on an ‘apples for apples’ basis. To reduce the risk of inconsistency, we focus below on figures for England and Wales – accounting for approximately 88% of the UK population as a whole.
Death Statistics
Daily Deaths
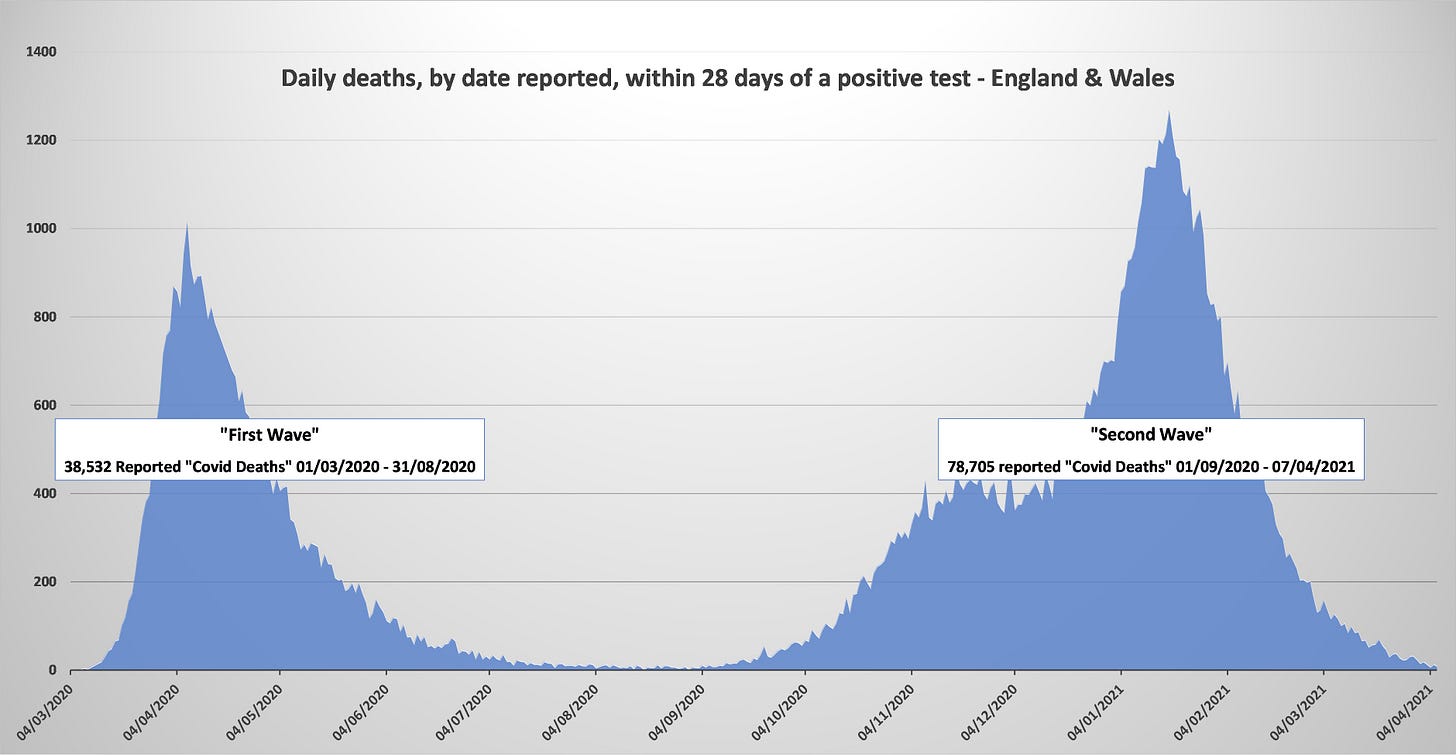
Figure 1: Deaths reported following a positive SARS-Cov-2 test
Figure 1 illustrates the pandemic from the perspective of the UK government (PHE) spin machine (data set 1 as described above), as constantly repeated by the mainstream media.
These are the deaths following a positive test result – mostly PCR tests until very recently. If you have been following only the official narrative, you could be forgiven for believing that anyone who claimed any significant degree of population (‘herd’) immunity last summer, following the ‘first wave’ of the pandemic, was a charlatan, and that a combination of complacency and lack of adherence to the rules led to a much greater impact in the ‘second wave’.
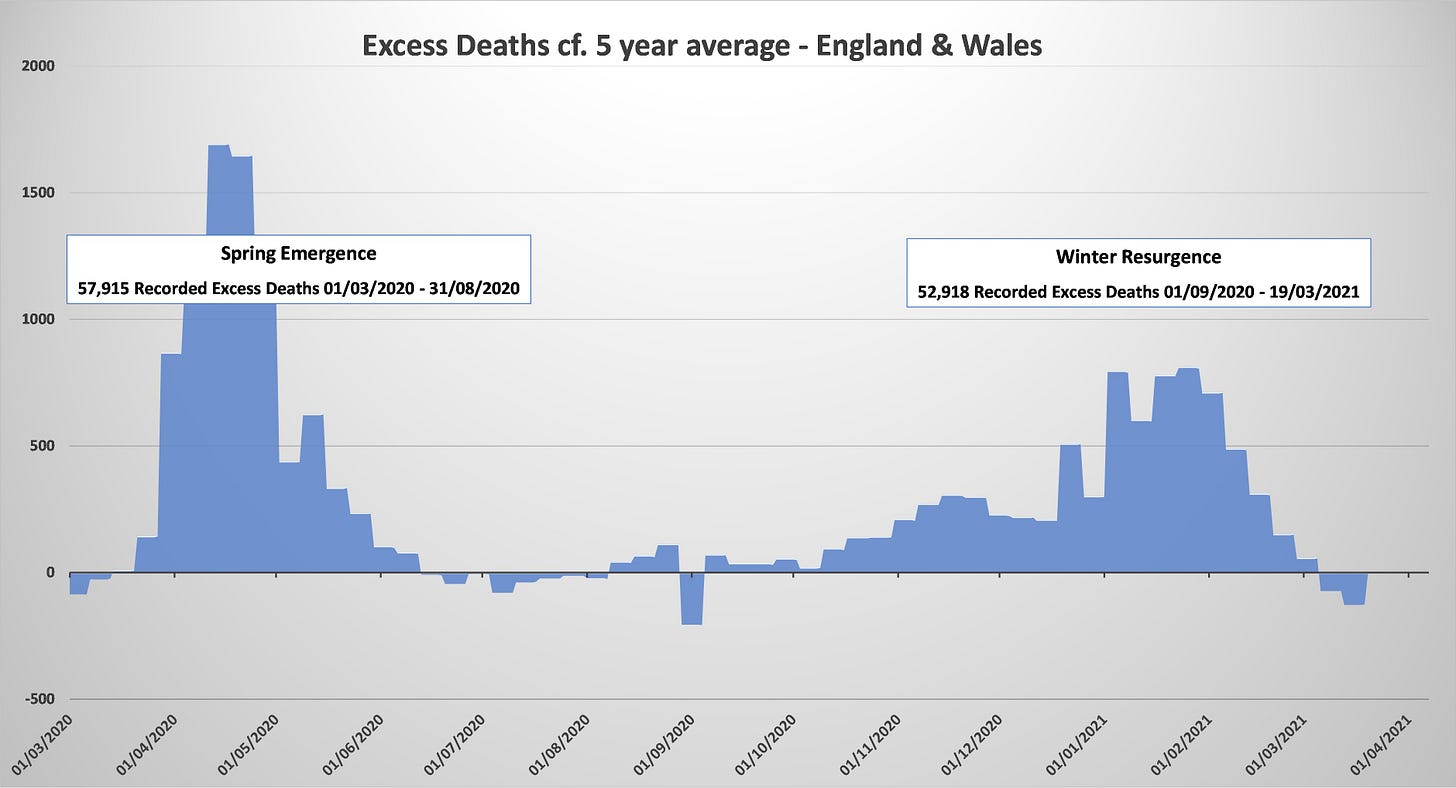
Figure 2: Excess deaths compared to previous 5-year average
In fact, as shown in the chart for excess deaths at figure 2, the majority (52%) of excess deaths since the start of the pandemic (as reported by the ONS) happened following the initial emergence of the virus. It is obvious that the peak in the excess death rate was also last spring.
Taken together, what figures 1 & 2 clearly illustrate is a significant misattribution of deaths; under-reporting of Covid deaths last spring and very significant over-reporting during the past winter, especially during January and February. While it is also clear that those claiming full herd immunity last summer were over-optimistic, this was arguably to a far lesser degree than the alarmists were over-pessimistic.
It stands to reason that, if there has been misattribution deaths to Covid, we would expect an equal and opposite misreporting of deaths from other causes. This is exactly what we do see, in the monthly mortality analyses published by the ONS, which provide statistics for the top ten causes of death each month.
For example, the ONS mortality analysis for January 2021 shows a deficit of over 8,500 deaths for the top ten causes of death, excluding Covid, compared to the 5-year average:
Figure 3: ONS Mortality Analysis, January 2021
This analysis shows the misattribution of many deaths to Covid over the past winter (as well as the under-reporting of Covid deaths last spring).
But this is not the complete story, because we have not considered the ‘collateral’ impact of lockdown related deaths. It is beyond serious dispute that the impact of the pandemic, as well as our response on the normal functioning of the NHS and society at large, will have had significant negative consequences in terms of excess non-Covid deaths – i.e. we can reasonably say that these deaths have actually increased rather than decreased as implied in the ONS statistics.
Missed cancer treatments, undiagnosed cardio-vascular problems, adverse impacts of isolation on dementia patients, additional alcohol-related deaths, suicides – the effect of all these things and more is hidden in the ‘official’ statistics and we will probably never know the true impact over the past year. For the moment, all we can reference is the broad-brush potential; for example, every 1% increase in the 530,000 or so ‘normal’ deaths in England and Wales each winter would represent 5,300 additional non-Covid deaths misattributed to Covid.
However, while there has already undoubtedly been an impact in terms of collateral deaths, the true effect of our pandemic response on non-Covid deaths will become apparent in the next few years. Missed diagnoses and interrupted treatments will leave a legacy of health problems which could easily exceed the total number of true Covid deaths during the pandemic. For example this recent newspaper article speculates on the future effect on cancer deaths and reports that “Even before the second wave hit, Cancer Research UK estimated last summer that Covid could cause an extra 35,000 cancer deaths”.
Cumulative Death Totals
Figures 1 & 2 show the daily impact of the pandemic over the past year. An alternative perspective can be gained from looking at cumulative totals over the period, which also allows a comparison of the different data sets to be viewed on a single chart.
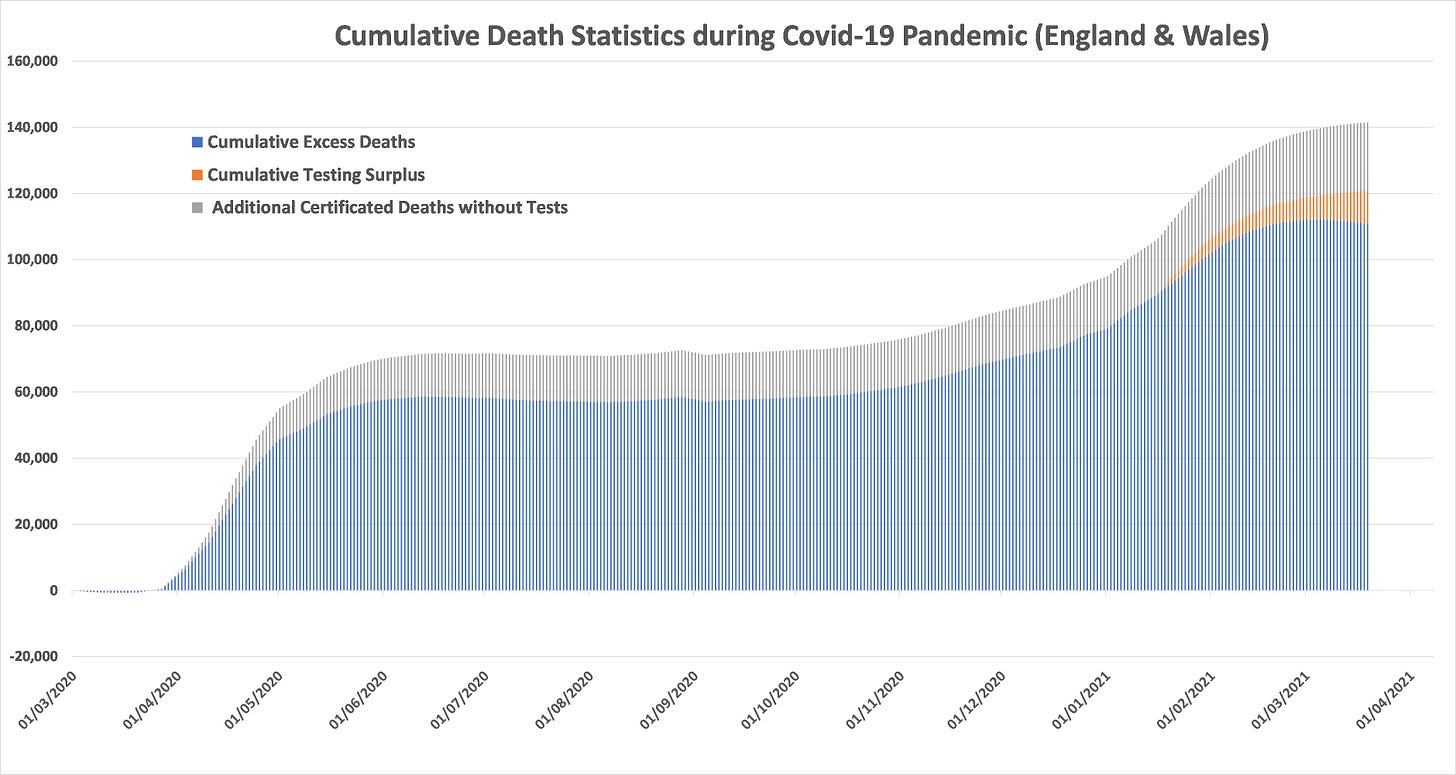
Figure 4 illustrates the cumulative totals for each of the 3 main data sets for deaths in England & Wales, providing a quick visual reference for how total deaths have been over-reported due to both an over-aggressive testing regime (orange) and the inaccurate analysis of death certificate statistics (grey).
Figure 4: Cumulative deaths to date
The core of the chart, in blue, shows cumulative excess deaths over the period of the pandemic, compared to average of the past 5 years.
Note that the impact of testing data (orange) on cumulative statistics (unlike the daily numbers shown in figures 1 & 2) only manifests in recent months. This is due to two factors:
The relative absence of mass testing last spring and summer means that there was a deficit of deaths reported following positive tests, compared to excess deaths, in the early stages of the pandemic. This is apparent in figures 1 and 2, where the excess deaths in the “first wave” exceeded reported Covid deaths by nearly 20,000.
Following the change in reporting methodology last August, approximately 5,000 deaths which had occurred more than 28 days after a positive test were removed from the totals.
Cumulative ‘testing deaths’ therefore began with a significant deficit, which only became a cumulative surplus during January. This does not detract from the fact that the counting of ‘Covid deaths’ from testing has significantly distorted the number of true Covid deaths during the past winter – as clearly shown by a comparison of figures 1 and 2 – leading to the mistaken impression, never corrected by the government, the public health establishment, or the mainstream media, that the “second wave” was far more deadly than the first.
Other Considerations
The Effect of Lockdowns
Defenders of the UK response generally argue that without mitigation – social distancing, masks, lockdowns – the death toll would have been much higher, and that these measures prevented an altogether more catastrophic outcome.
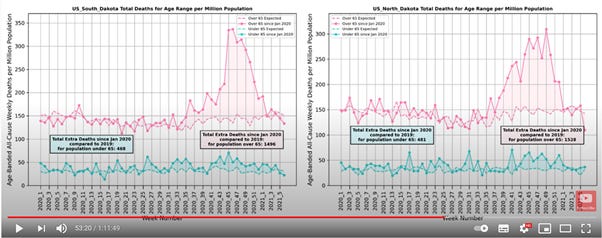
However, there is little if any convincing evidence for the efficacy of these ‘mitigations’. Scientific studies of the effect of face coverings are inconclusive, to put it charitably, and there are many comparisons available between similar countries and regions which adopted very different lockdown strategies and achieved very similar outcomes; few more striking perhaps than North and South Dakota, as outlined by Professor Michael Levitt in the previously referenced video interview, from which we have copied the screenshot below. South Dakota, which never imposed lockdown, has so far had an indistinguishable outcome from its immediate neighbour North Dakota, which did.
Figure 5: Comparison Between North & South Dakota (credit Ivor Cummins)
Infection Control in Hospitals and Care Homes
Far from efficiently minimising the death toll from the pandemic, many (including ourselves in our previous paper) point to the negative impacts of many ‘mitigations’ or lack thereof: Most notably the discharge of elderly patients into care homes at the start of the pandemic and the number of avoidable hospital-acquired infections.
This interactive reporting tool from PHE shows that approximately 50% of the excess deaths in the first wave occurred in care homes. We will probably never know how many of these deaths were directly caused by the NHS policy of discharging elderly patients without tests, but 10% of the 58,000 first wave total would represent a very significant 5,800 avoidable deaths.
Figure 6: Excess Deaths in England – Comparison Between All Settings and Care Homes
The Effect of Improved Treatment
There is no question that front-line healthcare for those unfortunate enough to be seriously affected by the disease has improved significantly over the course of the past year.
Better prophylactic (preventative) and therapeutic treatments have lessened the severity of illness, while improved understanding of the risk/benefit equation for intubating patients has also improved outcomes.
The Impact of Vaccinations
The final defence of lockdown proponents is that vaccines arrived just in time to save the day, preventing an altogether more catastrophic outcome – although the UK Prime Minister Boris Johnson has recently claimed, somewhat controversially, that vaccination has thus far contributed little in the way of mortality reduction compared to lockdowns.
Despite the PM’s bizarre departure from the script, vaccinations have undoubtedly accelerated the level of population immunity beyond the levels achieved naturally. Crucially however, the level of naturally-acquired immunity – either from direct exposure to the virus or from pre-existing cross-immunity – was likely around 50% before the vaccine rollout began.
Estimates of the number of people who have already been exposed vary widely, with many reports such as this based on seroprevalence (antibody) studies. Since antibodies wane after a few months, recent seroprevalence studies are likely to exclude most people affected in the first wave, and thus significantly under-estimate the true level of naturally-acquired immunity.
Despite the uncertainty inherent in any theoretical analysis of acquired or pre-existing immunity, the empirical evidence is clear. All indicators – infections, hospitalisations and deaths – have been improving constantly, and in a natural exponential manner, since early January, when very few people had yet been vaccinated.
Conclusions
The total number of pandemic deaths in England and Wales has been exaggerated in the public consciousness. The true number is just under 111k, compared to a little over 117k reported following positive tests and up to 150k often quoted for the UK overall (where Covid has been quoted anywhere on the death certificate).
Contrary to the widely held public belief that the 2nd wave has been much more deadly than the 1st, the overall number of 53k excess deaths in the past winter has been comparable to – actually somewhat less than – the 58k during the initial emergence of the pandemic in the UK last spring. The peak rate of excess deaths last spring was more than double the peak rate of the past winter.
Excess deaths last spring were undoubtedly due entirely to Covid (albeit that some understandable mistakes were made in the treatment of seriously ill patients and there was a lack of therapeutic drugs available initially). However, excess deaths during the past winter cannot credibly be assigned exclusively to Covid. Every 1% increase above average death rates for non-Covid mortality would represent an additional 5,300 misattributed deaths. This magnifies the differential between the severity of the pandemic last spring compared to the past winter.
In short, the overall mortality impact of Covid has been overstated and the “first wave” of the pandemic was probably twice as deadly as the winter resurgence.
We estimate over-reporting of total Covid deaths of between 5% and 25% (25% is now being quoted for recent weeks, even in the mainstream press). Defenders of the UK response would probably claim that without mitigation the death toll would have been much higher anyway, and that the vaccines arrived just in time to save the day, preventing an altogether more catastrophic outcome. Others will challenge those claims, for example by pointing to the negative impacts of many ‘mitigations’ as reflected in our previous paper, most notably the discharge of elderly patients into care homes at the start of the pandemic and the number of avoidable hospital-acquired infections.
The key point is that not all excess deaths are even attributable directly to Covid, and the public have not been provided with an honest or impartial narrative. Unprecedented socio-economic damage has been inflicted on the British people based on a false representation of the facts, in a psychological warfare campaign of fear orchestrated by the government.
We will address our final comments to the consequences of this complete breakdown of national honesty and rational scientific analysis:
While of course serious, the pandemic was never the truly exceptional public health crisis it has been portrayed as.
To date, the total mortality impact in England and Wales has been approximately 111,000 excess deaths over two winter seasons. Mostly of course amongst the very elderly.
Whether the socio-economic damage to the UK would have been worth it, even if the most alarmist forecasts of the potential unmitigated death toll were borne out, is a matter of subjective qualitative assessment, involving moral and ethical judgments rather than cold scientific analysis. However, those alarmist predictions were not borne out. They were never credibly likely to be, but any dissenting voices have been continuously silenced by a malign establishment consensus.
The British people will be paying the consequences of this fiasco for many years to come. We must now have a full, honest and impartial public enquiry into how such a national calamity was ever allowed to happen.
Finally, we must now put a complete stop to the ongoing myth that the UK is still in the middle of a civilisation-threatening pandemic. The threat is, and always has been, from our response not from the disease.
There is now an even greater threat; that the precedent of lockdowns and civil liberties violations provides a green light for future governments to impose more draconian restrictions in the name of ‘saving the climate’. The risk of climate change lock downs is now very real.
All restrictions on economic activity and civil liberties must end, and all emergency legislation repealed:
All mass testing should stop immediately.
All travel restrictions should be ended, including international travel.
All mask mandates should be rescinded.
Everything should return to normal - hospitality should be opened completely, full crowds allowed at major events, and so on.
An immediate Public Enquiry should be established, with unconstrained terms of reference to investigate every aspect of our pandemic response, including healthcare, financial, civil liberties, censorship and more.


